Ever sat at your kitchen table, scrolling through endless charts of fixed indexed annuity rates, and felt like the numbers were speaking a foreign language? You’re not alone—most of us have stared at those percentages and wondered if they’re really worth the hype. In this intro, I’ll walk you through why those rates matter and what to look for before you sign anything.
Think about it this way: a fixed indexed annuity promises a minimum guaranteed return, but it also lets you capture upside from market indexes without the risk of losing principal. That safety net can feel like a warm blanket on a chilly night, especially when you’re planning for retirement and can’t afford big swings. The catch? The credited rate is often tied to a participation percentage and a cap, which can mute the growth you hoped for.
Now, imagine you’re a family looking to protect your kids’ future while keeping enough cash flow for today’s bills. You might compare a 3% guaranteed floor with a 5% participation rate on the S&P 500, knowing the cap sits at 8%. If the market climbs 12% this year, you’d actually see about 7% credited—still better than a plain fixed annuity, but not the full market rally. That trade‑off is the heart of understanding fixed indexed annuity rates.
So, how do you decide if the rates on the table are right for you? First, write down the guaranteed minimum and the participation level—these are the numbers that won’t change regardless of market chaos. Next, run a quick scenario: take your expected contribution, apply the participation rate, and cap it at the maximum. If the result feels comfortable and aligns with your retirement timeline, you’ve got a solid baseline.
Finally, remember that rates can vary by carrier and by the length of the income phase. A quick chat with a trusted advisor at Life Care Benefit Services can help you compare the fine print, run personalized projections, and make sure you’re not leaving money on the table.
TL;DR
Fixed indexed annuity rates promise a guaranteed minimum return plus upside tied to a participation rate and cap; compare the floor, participation, and cap to your retirement goals and run a scenario.
If numbers feel right, talk to a Life Care Benefit Services advisor to tailor product for cash‑flow needs.
Understanding Fixed Indexed Annuity Rate Basics
When you first see a table of fixed indexed annuity rates, it can feel like you’ve walked into a math class you never signed up for. The good news? The numbers are actually telling a story about protection and upside – and we can break that story down together.
What the three key numbers mean
First, there’s the guaranteed floor. That’s the minimum interest you’ll earn even if the market tanks. Think of it as a safety net that keeps your principal from slipping.
Next up is the participation rate. This tells you what slice of the index’s gain you’ll actually keep. A 70% participation rate means if the S&P 500 jumps 10%, you get 7% credited (subject to caps).
Finally, the cap (or spread) puts a ceiling on that upside. If the cap is 8% and the index soars 12%, you’re still limited to an 8% credit.
Put those three together, and you can calculate a realistic “best‑case” credit for any market scenario.
Real‑world example: the Smith family
Meet the Smiths – a couple in their early 60s with $150,000 they want to protect while still chasing a bit of growth. Their carrier offers a 2% guaranteed floor, 60% participation, and a 6% cap.
Scenario 1: The market climbs 5% in a year. Their credited rate = 2% floor + (5% × 60% = 3%) = 5% total – well below the 6% cap, so they earn 5%.
Scenario 2: The market jumps 12%. Participation gives them 7.2% (12% × 60%). Add the 2% floor = 9.2%, but the 6% cap kicks in, so they only get 6%.
Scenario 3: The market falls –4%. The floor protects them, so they still earn the 2% minimum.
Seeing the numbers in action helps the Smiths decide if the trade‑off feels right for their retirement timeline.
How to run your own quick check
1. Write down the three numbers from your contract.
2. Pick a realistic market return range – low (0‑2%), medium (5‑7%), high (10‑12%).
3. Apply the participation rate to each market return, add the floor, then cap the result.
4. Compare the outcomes to a plain fixed annuity (often 3‑4% guaranteed) and to a CD (currently about 2%).
If the medium‑scenario credit exceeds the fixed rate by a comfortable margin, the FIA might be a good fit.
Expert tip: watch the “reset period”
Most contracts reset annually, but some use a 3‑year “point‑to‑point” method. Longer reset periods can smooth out volatility, but they also delay your ability to capture a strong market year. Ask your advisor to clarify the reset schedule before you lock in a rate.
Another nuance is the “annual fee” – many FIA products have no ongoing charges unless you add a rider. If you do add a lifetime income rider, expect a cost of about 0.5%‑1% of the account value, which will shave off your effective credit.
Putting it all together
Understanding the floor, participation, and cap gives you a clear lens to compare offers. Use a simple spreadsheet or an online calculator – just make sure it lets you input all three variables.
For a quick, no‑risk way to see how different rate structures affect your retirement cash flow, try the Income Annuity Estimator: Calculate Your Payout and plug in your numbers.
When you’ve run the scenarios, you’ll know whether the upside potential outweighs the caps, and you can talk to a Life Care Benefit Services advisor with confidence.
Remember, the goal isn’t to chase the highest possible credit – it’s to secure a predictable, protected income stream that matches your comfort level.
An indexed annuity’s growth mechanics explain how the crediting methods (point‑to‑point, monthly average, etc.) influence the final rate, so reviewing the method your carrier uses is worth a few extra minutes.

How Fixed Indexed Annuity Rates Are Calculated
Alright, let’s pull back the curtain on the math behind fixed indexed annuity rates. You’ve already seen the floor, participation, and cap – now we’ll walk through exactly how those pieces turn into the credit you actually earn.
Think of the calculation as a three‑step recipe: start with the guaranteed floor, add the upside you capture from the market (that’s the participation rate applied to the index gain), then slap on the cap if you’ve hit the ceiling. If the market dip would push you below the floor, the floor wins and you still get that minimum.
Step 1: Gather the contract numbers
Grab three figures from your annuity contract:
- Guaranteed floor (e.g., 2%)
- Participation rate (e.g., 70%)
- Cap or spread (e.g., 8% max credit)
That’s all you need before you even look at a market scenario.
Step 2: Pick a realistic index return
Choose a range that feels plausible for the index you’re tied to – low (0‑2%), medium (5‑7%), high (10‑12%). You don’t have to be a Wall Street wizard; just think about how the S&P 500 has behaved over the past few years.
Let’s say you expect a 9% rise this year.
Step 3: Do the math
First, apply the participation rate: 9% × 70% = 6.3%.
Next, add the floor: 2% + 6.3% = 8.3%.
Finally, compare to the cap. If your cap is 8%, the 8.3% gets trimmed down to 8% – that’s the rate that will be credited to your account for the year.
Quick checklist
- Write down floor, participation, cap.
- Choose an index return scenario.
- Multiply return by participation.
- Add the floor.
- If result > cap, set it to cap.
- If result < floor, set it to floor.
Sound simple? Most people feel a little wobble the first time, but once you run the numbers a couple of times it clicks.
Let’s run another example, this time with a market dip. Suppose the index falls ‑4%.
Participation gives you ‑4% × 70% = ‑2.8%. Add the floor (2%) and you get ‑0.8%. Because the floor guarantees at least 2%, the negative result gets overridden and you still earn the full 2% minimum.
That safety net is why many retirees love FIAs – the floor protects you when markets tumble, while the participation lets you join the upside when they rise.
Credit methods matter too
Different carriers use point‑to‑point, monthly average, or annual reset methods to measure the index gain. The method you pick can change the effective return, especially in volatile years. A point‑to‑point approach looks at the index level on the contract start date versus the end date, while a monthly average smooths out spikes by averaging each month’s change. Ask your advisor which method your product uses and run the same three‑step calc for each – you might discover a subtle boost or a hidden limitation.
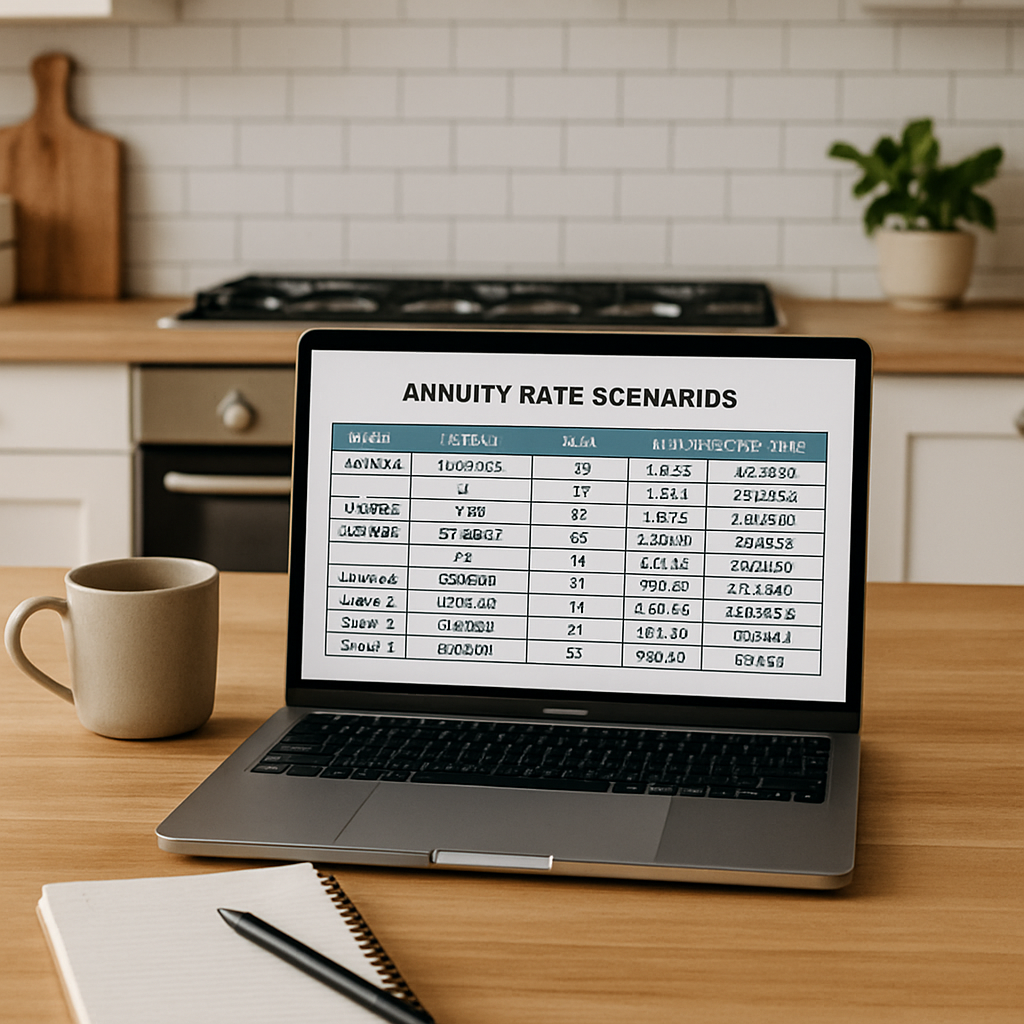
Here’s a handy visual that breaks down the steps:
After you’ve crunched a few scenarios, you’ll have a clear picture of how the “best‑case” credit stacks up against a plain fixed annuity or a CD. If the medium‑scenario credit comfortably beats those alternatives, the FIA is likely a good fit for your retirement plan.
Ready to put this into practice? Pull up a spreadsheet, plug in your numbers, and watch the math demystify the jargon. And when you’re confident you’ve found a rate structure that matches your comfort level, give Life Care Benefit Services a call. We’ll walk you through the carrier options, verify the crediting method, and help you lock in a rate that feels right for your family’s future.
Comparing Fixed Indexed Annuity Rate Options Across Providers
Now that you’ve seen how to calculate a credit, the next step is to line up the actual offers you might see on the market. That’s where comparing fixed indexed annuity rates across providers becomes the real game‑changer.
Every carrier dresses the same three ingredients – floor, participation, cap – in a slightly different outfit. One might give you a 2% guaranteed floor with a 60% participation and a 6% cap, while another offers a 2.5% floor, 70% participation and an 8% cap. The numbers look similar on paper, but the resulting credit can swing a full percentage point or more depending on how the market moves.
So, how do you know which combo actually lines up with your comfort level?
Start with your personal market outlook. If you’re comfortable assuming a medium‑scenario rise of 5‑7%, plug each provider’s numbers into the three‑step recipe we covered earlier. The provider with the higher participation will usually win in a strong market, but its cap might bite you if the index spikes past the ceiling. Conversely, a higher floor can be a silent hero when the market dips.
A quick cheat‑sheet you can print out works wonders. Grab a spreadsheet, list each carrier’s three numbers, and add a column for the “medium‑case credit” and another for the “worst‑case floor.” The rows that give you a credit comfortably above a plain fixed annuity (often 3‑4% these days) are the ones worth a deeper dive current fixed annuity rates.
Take the Smith family from earlier: with Carrier B’s 70% participation and 8% cap, a 6% market gain translates to 2.5% floor + (6% × 70% = 4.2%) = 6.7%, trimmed back to the 8% cap, so they’d actually lock in 6.7% – a nice bump over Carrier A’s 5% result. If the market only nudges up 3%, Carrier A’s higher floor still guarantees them 2% versus Carrier B’s 2.5% floor plus 2.1% participation = 4.6% – still better, but the gap narrows.
Here’s a snapshot of three typical offers you might encounter:
| Provider | Participation Rate | Cap | Guaranteed Floor |
|---|---|---|---|
| Carrier A | 60% | 6% | 2% |
| Carrier B | 70% | 8% | 2.5% |
| Carrier C | 65% | 6.5% | 2% |
Does a higher participation always trump a higher floor? Not necessarily. In a flat or mildly negative year, the floor protects your principal and gives you a modest return, while the extra participation never gets to shine. That’s why we always run both the “best‑case” and “worst‑case” scenarios side by side.
Another factor that often slips through the cracks is the reset method. Some carriers use a point‑to‑point 5‑year reset, others a monthly‑average reset. The same participation and cap can produce different effective rates because the monthly average smooths out spikes. If you’re a bit risk‑averse, the smoother method usually yields a more predictable credit.
One more tip: watch for any rider fees or surrender charges hidden in the fine print. A carrier might tout a juicy 70% participation, but a 0.8% annual rider fee will shave that credit down. Ask your Life Care Benefit Services advisor to break out the net‑of‑fees rate before you sign.
Bottom line: create a side‑by‑side comparison, run the three‑step calc for at least two market scenarios, and then ask yourself which combination of floor, participation, cap, and reset method feels like the right balance of upside and safety for your retirement horizon.
Ready to see the real numbers for your situation? Schedule a free consultation with Life Care Benefit Services today and we’ll pull the latest fixed indexed annuity rates from top‑rated carriers, run the numbers together, and help you lock in a rate that matches your goals.
Impact of Market Conditions on Fixed Indexed Annuity Rates
Ever wonder why the same FIA product can look so different from one year to the next? It all comes down to what’s happening in the broader market – especially interest rates and equity volatility.
When rates are high, insurers earn more on the bonds they hold in the general account. That extra yield lets them crank up the guaranteed floor, lift participation caps, or even offer more flexible crediting options. In fact, the fourth quarter of 2024 saw FIA sales jump 22% year‑over‑year, a surge driven largely by that high‑rate environment.Read more about the recent sales boom.
How a rising‑rate backdrop boosts the floor
Think of the guaranteed floor as the safety net underneath your retirement pond. When the Fed hikes rates, insurers can invest more of the premium in higher‑yielding bonds. That extra income translates directly into a higher floor – maybe 2.5% instead of 2%.
Why does that matter? Even if the market index tanks, you still walk away with that floor credit. It’s the “no‑matter‑what” piece that keeps retirees sleeping soundly.
Participation rates and caps in a volatile market
Participation rates (the slice of the index upside you capture) and caps (the ceiling on that upside) are more sensitive to equity swings. In a bull market, a 70% participation with an 8% cap can look gorgeous. But if the index jumps 15% and you’re capped at 8%, you lose a lot of the potential gain.
Conversely, when volatility spikes, a smoother reset method – like monthly‑average – can temper the highs and lows, often delivering a more predictable credit. That’s why many advisors suggest matching the reset style to your risk comfort.
What happens when rates start to fall?
If the Fed eases and bond yields dip, insurers’ investment income shrinks. You might see the guaranteed floor inch down or caps become tighter. Some carriers even raise rider fees to make up the shortfall.
That doesn’t mean FIAs become useless; they still protect principal. But the “extra” upside you were banking on may shrink, so it’s wise to lock in a contract while rates are still generous.
So, how can you turn this market‑noise into a concrete plan?
Quick checklist for today’s market
- Look at the current guaranteed floor – is it above the prevailing CD rates?
- Compare participation percentages – higher is better in a bullish outlook.
- Check the cap – a higher cap protects you when the market really takes off.
- Ask about the reset method – point‑to‑point versus monthly average can change your effective credit.
- Confirm any rider or surrender fees – they can eat into the upside you expect.
Once you have those numbers, run at least two scenarios: a “best‑case” year with a strong market rally and a “worst‑case” year with a flat or negative index. If the floor still outperforms a traditional fixed annuity in the down market, you’ve got a solid safety net.

Bottom line: Fixed indexed annuity rates don’t exist in a vacuum. They breathe with the interest‑rate cycle and equity market mood. By staying aware of where rates are headed and how volatility might shape the index, you can pick a contract that gives you both a comfy floor and enough upside to make retirement feel like a steady climb rather than a roller coaster.
Ready to see how today’s market conditions line up with the best FIA offers? Give Life Care Benefit Services a call, and we’ll walk you through the latest rates, run personalized scenarios, and help you lock in a rate that fits your retirement goals.
Choosing the Right Fixed Indexed Annuity Rate for Your Retirement Plan
So you’ve scoped out the floor, participation and cap – now what? That’s the moment where the numbers stop feeling abstract and start shaping your retirement story. Let’s walk through a practical, step‑by‑step way to pick the fixed indexed annuity rate that actually lines up with the life you want to live.
Step 1: Define Your retirement goals
First, get clear on the picture you’re aiming for. Are you hoping to replace a big chunk of your salary, or just add a safety net that covers a few bills? Write down the income you need each month, the age you’d like to start drawing, and how much wiggle‑room you want for unexpected expenses.
When you know the dollar target, you can translate it into a required annual return. That number becomes the baseline for evaluating any rate you’re considering.
Step 2: Gather the rate components
Pull the three ingredients from every contract you’re looking at: the guaranteed floor, the participation percentage, and the cap (or spread). Most carriers publish these in a rate table, and you’ll often see floors ranging from 1% to 3% – a range that protects you even when the market goes south according to annuity.org.
Jot them into a simple spreadsheet. One column for each component, another for the reset method (point‑to‑point, monthly‑average, etc.), because that can shift the effective credit.
Step 3: Model real‑world scenarios
Pick three market outlooks that feel realistic for you: a modest 2‑3% gain, a medium 5‑6% gain, and an optimistic 9‑10% gain. For each outlook, apply the participation rate, add the floor, then cap the result. The formula looks like this:
Credited Rate = min( floor , floor + (market return × participation) , cap )
Run the numbers for each scenario. If the “medium” case still beats a plain fixed annuity (usually 3‑4% these days), you’ve got a candidate.
Quick checklist for the spreadsheet
- Floor (e.g., 2%)
- Participation (e.g., 70%)
- Cap (e.g., 8%)
- Reset method note
- Result for low, medium, high market
Look for a rate that gives you a comfortable cushion in the low‑case and a nice boost in the high‑case.
Step 4: Compare across providers
Now line up the same three‑scenario results for every carrier you’ve gathered. You’ll often see a trade‑off: one product may have a higher floor but a lower participation, while another flips that balance.
Ask yourself which trade‑off matters more for your risk comfort. If you can tolerate a flat market, a higher floor is a silent hero. If you’re confident the market will climb, the higher participation and cap become the star players.
Don’t forget to factor in any rider fees or surrender charges – those can eat into the net credit you just calculated.
Step 5: Lock in when the floor feels right
When you’ve identified a rate that meets your income target in the medium scenario and still protects you in the down market, it’s time to act. Rates can shift as interest‑rate cycles change, so waiting too long might mean losing a floor that’s currently above CD yields.
Give Life Care Benefit Services a call. Our advisors can verify the latest carrier tables, confirm the reset method, and walk you through the paperwork so the rate you’ve chosen becomes a solid part of your retirement plan.
Remember, the goal isn’t to chase the highest cap ever advertised; it’s to choose a rate that feels like a comfortable, predictable step toward the retirement lifestyle you’ve imagined.
FAQ
What exactly are fixed indexed annuity rates and how do they work?
Fixed indexed annuity rates are the crediting numbers that determine how much interest your account earns each year. They’re built from three pieces – a guaranteed floor that never drops below a set percent, a participation rate that lets you capture a slice of an index’s gain, and a cap that limits the upside. When the market climbs, you apply the participation to the index return, add the floor, and then the cap trims any excess. If the market falls, the floor protects you, so you still earn the minimum rate.
How can I compare the participation rate versus the cap when choosing a product?
Start by picturing two market scenarios: a modest 5% rise and a strong 12% rally. Multiply each scenario by the participation rate, add the floor, then see whether the result hits the cap. A higher participation gives you more upside in the 5% case, but a lower cap can bite you in the 12% case. Write both results side‑by‑side in a quick spreadsheet – the option that delivers a better “medium‑case” credit while still protecting you in a downturn is usually the sweet spot.
Does the reset method (point‑to‑point vs. monthly‑average) affect the rates I’ll actually receive?
Yes, the reset method changes how the index’s performance is measured. Point‑to‑point looks at the index level on the contract start date versus the end date, so a single big jump can boost your credit. Monthly‑average smooths out spikes by averaging each month’s change, which often leads to a more consistent, but sometimes lower, credited rate. Ask your advisor which method the carrier uses and run the three‑step calculation for both to see the impact on your projected returns.
What role do rider fees play in the effective fixed indexed annuity rate?
Rider fees are charged for optional benefits like guaranteed lifetime income. They’re typically expressed as a percentage of your account value each year. Even a 0.7% fee can shave a noticeable amount off the credited rate, especially in low‑interest environments. When you run your scenario calculations, subtract the rider fee from the projected credit to get the net‑of‑fees rate. That net figure is what will actually affect your retirement cash flow.
How often do insurers change the guaranteed floor and cap, and should I lock in a rate now?
Insurers adjust floors and caps as interest‑rate cycles shift, usually at the start of a new pricing period every six to twelve months. When rates are high, you’ll see higher floors and more generous caps; when yields fall, those numbers can dip. If you’ve found a floor that’s already above prevailing CD rates and the participation matches your comfort level, it’s often wise to lock it in sooner rather than later, because waiting could mean losing that favorable rate.
What’s the best way to make sure my fixed indexed annuity fits my retirement income goals?
First, calculate the annual income you’ll need in retirement and translate that into a required return on your annuity balance. Then, run the three‑step credit calculation for low, medium, and high market scenarios with the product’s floor, participation, and cap. Compare the medium‑case credit to the return you need. If it clears the hurdle and the floor still beats a plain fixed annuity, you’ve got a solid match. Finally, sit down with a Life Care Benefit Services advisor to confirm the numbers, review any rider costs, and finalize the paperwork.
Conclusion
We’ve walked through the floor, participation rate, and cap, and you’ve seen how a quick three‑step calculation can turn those numbers into a realistic credit.
So, what does that mean for you? It means you can compare offers without getting lost in insurance jargon, and you can pick the fixed indexed annuity rates that actually line up with your retirement cash‑flow goals.
Remember the simple checklist: write down the guaranteed floor, note the participation percentage, record the cap, and run low‑, medium‑, and high‑market scenarios. If the medium case comfortably beats a plain fixed annuity and the floor stays above current CD yields, you’ve got a solid match.
One last tip: rates shift whenever interest‑rate cycles change, so once you find a floor that feels right, consider locking it in sooner rather than later. Waiting could cost you the extra buffer you counted on.
Ready to turn those numbers into a confidence‑boosting plan? Give Life Care Benefit Services a call today. Our advisors will pull the latest carrier tables, run the scenarios with you, and help you lock in fixed indexed annuity rates that protect your family’s future.
Keep this process in a notebook or a simple spreadsheet so you can revisit it whenever market conditions shift. The habit of re‑checking your numbers will keep your retirement plan on track.