Ever stared at a spreadsheet and wondered if there’s a simpler way to see how an indexed universal life policy could fit your budget? You’re not alone—most families feel a mix of curiosity and overwhelm when they first hear about an indexed universal life calculator.
That tool is basically a friendly math partner. It takes the numbers you already have—your current death benefit, premium payments, and cash‑value projection—and runs them through the policy’s crediting strategy to show you what your cash value might look like in five, ten, or twenty years.
Why does that matter? Because it turns vague insurance talk into concrete scenarios. Imagine you’re a homeowner who wants to protect the mortgage and also build a retirement nest egg. Plugging your mortgage balance and your desired retirement income into the calculator can reveal whether the IUL’s cash growth will cover both goals without you having to guess.
Or picture a small‑business owner juggling payroll and health benefits. By entering the projected payroll expenses and the number of employees, the calculator can highlight how an IUL could serve as a tax‑advantaged reserve for unexpected expenses, giving you peace of mind on those long‑run days.
And the best part? You don’t need a finance degree to interpret the results. The calculator usually outputs a clear table—showing projected cash value, death benefit, and potential living‑benefit withdrawals—so you can compare it side‑by‑side with other savings options.
So, does the indexed universal life calculator really simplify your planning? In practice, it gives you a visual roadmap, letting you see trade‑offs before you lock in a policy. That way, you avoid the “I wish I’d known earlier” regret that many policyholders experience.
If you’re ready to see those numbers for yourself, grab your latest policy statement or a simple quote and run it through an indexed universal life calculator. The insight you gain can shape a smarter, more secure financial future for your family or business.
Let’s take the guesswork out of the equation—schedule a free consultation with Life Care Benefit Services today and turn those projections into a plan you can feel confident about.
TL;DR
The indexed universal life calculator converts policy data into death‑benefit forecasts, showing how IUL can protect your family, grow retirement savings, and cover surprises.
Run your numbers today, compare results, and schedule a free consultation with Life Care Benefit Services to lock in a plan that feels right for you.
Step 1: Gather Your Financial Details
Before you even fire up the indexed universal life calculator, you need a solid stack of numbers to feed it. Think of it like gathering ingredients before you start baking – you wouldn’t try to make a cake without flour, right?
First, pull out your most recent IUL policy statement or the quote you received from Life Care Benefit Services. You’ll be looking for three key figures: the current death benefit, the cash‑value balance, and your scheduled premium amount.
Why those three?
The death benefit tells the calculator how much protection you already have. The cash value is the part that can grow over time and be used for living benefits. And the premium? That’s the cash you’re committing each month, which the tool uses to model future growth.
And don’t forget any riders you’ve added – like a chronic illness rider or an accelerated death benefit rider. Those extra costs shift the cost‑of‑insurance table and can change the projection dramatically.
So, what should you do with those numbers?
Open a simple spreadsheet or a piece of paper. Create three columns: Item, Amount, and Notes. List each figure, note the date it was recorded, and add a quick comment if anything looks off (maybe a premium increase you weren’t expecting).
Once you’ve got that tidy list, you’re ready to plug it into the calculator. If you’re not sure where to start, check out How to Use an Indexed Universal Life Insurance Living Benefits Calculator for a step‑by‑step walkthrough.
Now, let’s talk about a couple of real‑world scenarios that illustrate why gathering the right details matters.
Scenario 1: The Mortgage‑Protecting Homeowner
You own a house with a $250,000 mortgage. Your policy shows a $300,000 death benefit, $45,000 cash value, and a $200 monthly premium. When you feed those numbers into the calculator, it might reveal that in ten years the cash value could cover the remaining mortgage balance, letting you walk away debt‑free if something happens.
But if you missed a rider cost or an old premium figure, the projection could be wildly inaccurate, leading you to either overpay for coverage or under‑protect your family.
Scenario 2: The Small‑Business Owner
Imagine you run a boutique consulting firm with five employees. You’ve added a group life rider that costs an extra $50 per month per employee. Those additional premiums need to be captured in your spreadsheet; otherwise the calculator will underestimate the cash‑value growth you could expect.
Seeing the numbers side‑by‑side helps you decide whether the IUL can also act as a tax‑advantaged reserve for unexpected business expenses.
Does this feel a bit overwhelming? It does at first, but once you have the data in front of you, the calculator does the heavy lifting.
Take a moment to watch the short video above – it walks through exactly how to input your numbers and interpret the output.
Now that you’ve collected everything, the next step is to actually run the calculator and compare different crediting strategies. But before you do, consider a quick sanity check: does your premium fit comfortably within your budget? If you’re stretching thin, you might want to adjust the face amount or explore a lower‑cost rider.
And here’s a little tip that often flies under the radar: many small businesses use employee benefit benchmarks to decide how much life insurance to offer. If you’re curious about that angle, Benchmarcx provides a handy benchmarking tool for employer benefits Benchmarcx. It can help you align your IUL offering with industry standards.
Finally, if you’re juggling health goals alongside financial planning – say you’re over 40 and looking at weight‑loss programs – you might appreciate the holistic mindset. A site like Weight Loss After 40 for Women shares lifestyle tips that complement the peace of mind an IUL can bring.
Ready to plug those numbers in? Grab your spreadsheet, fire up the indexed universal life calculator, and let the numbers tell you a story about your future financial safety net.
Step 2: Understand Index Options and Participation Rates
Alright, you’ve got your numbers ready – now it’s time to decode the language the indexed universal life calculator talks in. Those terms like “participation rate” and “index option” can feel like insider speak, but they’re really just knobs you can turn to shape how your cash value grows.
First off, think of an index option as the flavor of a smoothie you’re ordering. Do you want a classic S&P 500 blend, a tech‑heavy Nasdaq mix, or maybe a more conservative bond‑based blend? Each option tracks a different market index, and the calculator will use the one you pick to project your policy’s crediting.
What is a Participation Rate?
The participation rate is the percentage of the index’s positive return that actually gets credited to your policy. If the S&P 500 climbs 10% in a year and your participation rate is 80%, you’ll see an 8% credit on the cash‑value side (assuming the crediting method allows it). It’s like a share of the market’s upside that the insurer lets you keep.
Most policies also have a cap – a ceiling on how much interest you can earn in a given period – and a floor, usually 0%, meaning you never lose cash value when the market dips.
So, why does the participation rate matter for the calculator? Because the tool needs that percentage to translate the index’s historical performance into a realistic projection for you. A higher rate means a more aggressive growth scenario, but it can also come with a higher cap or a larger premium.
Choosing the Right Index Option
Imagine you’re a homeowner like Jane from the previous step, and you’re comfortable with moderate growth. You might select an index that mirrors the S&P 500 and a participation rate of 70%. The calculator will then show you a steady, tax‑deferred build‑up that could help cover your mortgage and add a retirement cushion.
Now picture Mike, the small‑business owner, who wants a little extra upside to fund unexpected staffing costs. He could opt for a tech‑heavy index with a 85% participation rate, accepting a tighter cap because he’s banking on stronger market years.
When you plug these choices into the indexed universal life calculator, you’ll see two different curves: one smoother, one more “roller‑coaster‑ish.” Both are still protected by that 0% floor, so the worst‑case scenario is no growth, not a loss.
Here’s a quick tip: start with the most conservative option the calculator offers, see how the numbers look, then experiment with a higher participation rate if you feel comfortable. The visual comparison helps you decide how much risk you really want to take.
Notice how the video walks through a live example of swapping index options and watching the calculator update in real time. That visual cue can make the abstract numbers feel a lot more tangible.
Key Checklist for Index Options
- Identify which market index aligns with your risk tolerance (e.g., S&P 500, Nasdaq, blended).
- Check the participation rate offered for that index – higher isn’t always better if the cap is low.
- Confirm the cap and floor values; the floor protects you, the cap limits upside.
- Enter these values into the indexed universal life calculator and compare scenarios side‑by‑side.
- Ask your Life Care Benefit Services advisor to clarify any jargon you’re unsure about.
Remember, the calculator is just a modeling tool. It shows potential outcomes based on the participation rate and index you select, but real‑world results will also depend on fees, policy charges, and any riders you add.
Want a deeper dive into how participation rates work in practice? Allianz Life explains the mechanics of caps and participation rates, giving you a solid foundation before you hit “run” on the calculator.
Take a few minutes now to toggle the index options in your calculator. Watch the projected cash value shift, note which scenario feels right for your goals, and jot down the settings you liked. That simple experiment turns a confusing set of numbers into a clear, actionable plan.
Step 3: Using the Calculator – Live Demo
Alright, you’ve already gathered your numbers and picked an index. Now it’s time to sit down with the indexed universal life calculator and watch the magic happen. Think of it like a kitchen demo – you’ve got the ingredients, you just need to see how they blend.
1️⃣ Set Up Your Calculator Workspace
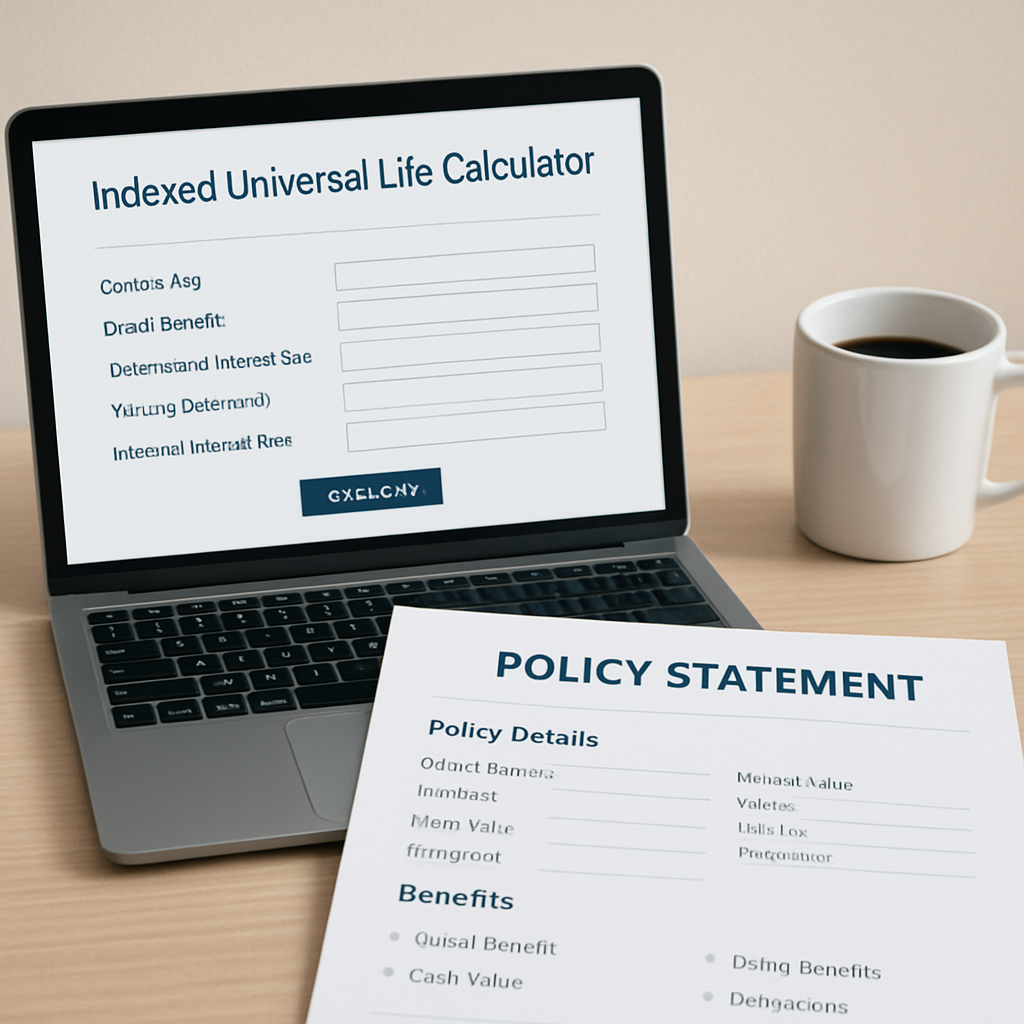
Open the calculator in a new browser tab. If you can, pull your policy statement, a notepad, and a cup of coffee so you don’t have to bounce back and forth.
First field: enter the current death benefit exactly as it appears on your statement. Next, type in the cash‑value balance – this is the “seed” the calculator will grow.
Then, plug in your regular premium amount. Most calculators let you choose monthly, quarterly, or annual payment frequency – pick the one that matches how you actually pay.
Tip: double‑check each figure before you move on. A single typo can throw the entire projection off by thousands.
2️⃣ Choose an Index and Participation Rate
Now you’ll see a dropdown of index options – S&P 500, Nasdaq‑100, a blended index, etc. Select the one you felt comfortable with in Step 2.
Enter the participation rate you want to test. Let’s say you’re curious about a 75 % rate for a moderate‑growth scenario.
If your calculator asks for a cap, type in the maximum credited rate the policy offers (often something like 12 %). The floor is usually pre‑filled at 0 % – that’s the safety net.
3️⃣ Run a Baseline Scenario
Hit the “Run” or “Calculate” button. In a few seconds you’ll get a table showing projected cash value at 5, 10, 15, and 20 years, plus the projected death benefit at each point.
Take a screenshot or export the results if the tool lets you. For many folks, seeing the numbers side‑by‑side with their mortgage balance or retirement goal makes the abstract feel concrete.
Example: Jane (the homeowner from earlier) entered a $500 k death benefit, $45 k cash value, $250 monthly premium, and chose the S&P 500 with a 70 % participation rate and a 10 % cap. The calculator showed a projected cash value of $78 k after ten years – enough to cover her $300 k mortgage if she also plans a $20 k annual retirement supplement.
4️⃣ Compare a More Aggressive Scenario
Now change the participation rate to 90 % and bump the cap to 12 %. Run the model again.
Notice the curve steepening. In Mike’s boutique‑studio case, the higher rate lifted the projected cash value from $150 k to $185 k after ten years, giving him extra breathing room for unexpected staffing costs.
Write down both sets of numbers. Seeing the delta helps you decide how much upside you’re comfortable chasing versus the extra premium you might need to pay for a higher cap.
5️⃣ Interpret the Results – What Do They Mean for You?
Look at three key columns:
- Projected Cash Value: This is the “savings bucket” you can tap for living benefits or to supplement retirement.
- Projected Death Benefit: Shows how much protection your loved ones would still receive if something happened to you.
- Required Premium: Some calculators update the premium needed to keep the policy in force under the new assumptions. If the number jumps dramatically, you may have hit a limit.
If the projected cash value after 20 years exceeds the amount you need for a mortgage payoff or a college fund, that scenario is a strong candidate.
6️⃣ Actionable Checklist Before You Close the Demo
- Record the index, participation rate, cap, and floor for each scenario.
- Note the cash‑value gap between your current balance and the target goal.
- Identify the premium increase (if any) required for higher upside.
- Write a brief “pros‑and‑cons” note: e.g., “Higher rate gives +$15k cash value but +$30/mo premium.”
- Schedule a call with your Life Care Benefit Services advisor to review the numbers and confirm policy charges.
That last step is crucial because the calculator doesn’t factor in policy fees, rider costs, or the cost‑of‑insurance ladder that can affect long‑term performance.
7️⃣ Quick Pro Tip
Run the calculator twice: once with the most conservative index (often a blended or bond‑based option) and once with your preferred growth index. The side‑by‑side view gives you a risk‑range envelope you can discuss with your advisor.
And if you’re tech‑savvy, copy the output into a simple spreadsheet and add a column for “What‑If” scenarios – like a 2 % increase in premium or a 5‑year early withdrawal. The more you play, the clearer the path becomes.
Ready to see the numbers dance? Open the indexed universal life calculator now, follow these steps, and you’ll walk away with a concrete, personalized plan instead of a vague feeling of “maybe this could work.”
Step 4: Compare Policy Scenarios
Now that you’ve run a few numbers, it’s time to put the scenarios side‑by‑side and actually see which one feels right.
Do you ever stare at two columns of data and wonder which one is the “sweet spot” for you? That’s exactly what this step is about – turning raw output into a decision you can sleep on.
Set up a quick comparison view
Grab the three runs you just did – maybe a conservative blend, a moderate S&P 500, and an aggressive tech‑heavy option. Pull the key figures into a simple table.
Here’s a minimal layout that works in any spreadsheet or even a notepad.
| Scenario | Index Option | Participation Rate | Projected Cash Value (10 yr) | Premium Δ |
|---|---|---|---|---|
| Conservative | Bond‑based blend | 60 % | $45,000 | +$0/mo |
| Balanced | S&P 500 | 70 % | $62,000 | +$20/mo |
| Aggressive | Nasdaq‑100 | 85 % | $78,000 | +$45/mo |
Notice how the cash‑value gap widens while the premium bump does too. That trade‑off is the heart of the comparison.
What the numbers really mean
First, check the “cash‑value gap” between each scenario and your target goal – maybe covering a $300 k mortgage or funding a $20 k annual retirement supplement.
Second, look at the premium increase. If the extra $45 a month pushes your budget over the edge, the higher upside might never be realized.
Third, remember the calculator doesn’t factor in policy fees, rider costs, or the cost‑of‑insurance ladder that ramps up as you age. Those hidden drags can shrink the projected values, especially on the aggressive side.
Quick sanity check checklist
- Does the projected cash value cover your primary goal? Tick.
- Is the premium increase affordable now and in the next 5‑10 years? Tick.
- Do the index option and participation rate match your risk comfort level? Tick.
- Have you noted any extra rider or fee that could eat into the projection? If you’re not sure, mark “review with advisor.”
And here’s a reality bite: many policies look great on paper, but the complexities and commission issues discussed by industry experts can turn a seemingly attractive scenario into a costly long‑term commitment.
Fine‑tune your assumptions
Before you lock in a number, tweak the cap, floor, and crediting method in the calculator. A 0% floor protects you, but a lower cap can shave off a few thousand dollars over 20 years. Play with those sliders and watch the table update in real time – it’s like a financial sandbox where you see the consequences before you commit.
If you have a rider for over‑loan protection, add its one‑time charge to the premium column. That tiny line item often makes the “aggressive” scenario look less appealing once you factor in the extra cost.
When to walk away
If every scenario shows a premium jump that exceeds 10% of your current cash flow, or if the projected cash value still falls short of a concrete goal (like paying off a $250 k mortgage), it’s a sign the policy may not be the right fit right now. In that case, consider a term policy paired with a separate taxable investment account – you keep flexibility and avoid the hidden insurance fees.
Next step: talk it through
Schedule a call with your Life Care Benefit Services advisor. Bring the table, your notes, and the “pros‑and‑cons” bullet list. A quick 20‑minute review will surface any hidden costs and help you lock in the scenario that feels both realistic and rewarding.
Remember, the goal isn’t to chase the highest projected number; it’s to pick the scenario that fits your budget, your risk appetite, and your life plan.
Ready to make a choice? Open your calculator, fill in the table, and let the numbers guide you to a policy that actually works for you.
Step 5: Interpret Results for Your Retirement and Mortgage Protection Plan
Ever stared at the calculator output and thought, “What does this actually mean for my mortgage or retirement?” You’re not alone—those rows of numbers can feel like a secret code.
Translate the cash‑value column into real‑world dollars
First, look at the projected cash value at the 10‑year mark. If you’re aiming to wipe out a $250 k mortgage, ask yourself whether that number plus any projected growth beyond year 10 will comfortably cover the balance plus a little buffer for interest.
Tip: write the mortgage payoff amount on a sticky note and place it next to the calculator screen. Seeing “$250 k” side‑by‑side with “$78 k projected cash value” makes the gap instantly obvious.
Check the death‑benefit trajectory
The death benefit column shows what your loved ones would receive if you weren’t here. For many families, the goal is a “dual‑purpose” policy: enough death benefit to protect the mortgage and enough cash value to fund retirement.
If the death benefit stays flat because the cash value is being used to pay premiums, you might need to bump up the base coverage or reconsider the premium schedule.
Premium affordability check
Now scroll to the “required premium” row. Does the number still fit your monthly budget? A common rule of thumb is that the premium shouldn’t exceed 10‑15 % of your take‑home pay.
If the calculator spikes the premium when you crank up the participation rate, you’ve found the sweet‑spot trade‑off: a little less upside for a lot less cash‑outflow.
Build a quick “yes‑or‑no” decision matrix
- Projected cash value ≥ mortgage payoff? ✔️
- Projected cash value ≥ retirement supplement goal? ✔️
- Premium increase ≤ budget threshold? ✔️
- Rider costs (over‑loan protection, etc.) accounted for? ✔️
If you check three out of four, you’re probably on the right track. If you’re missing one, go back to the calculator, tweak the index option or participation rate, and run it again.
Here’s a real‑world snapshot: Jane, the homeowner from earlier, ran a moderate S&P 500 scenario with a 70 % participation rate. The 20‑year cash projection hit $115 k, enough to cover her $300 k mortgage when paired with a $185 k death benefit. Her premium only nudged up $15 a month, which fit her budget comfortably. She felt confident because the numbers lined up with her two goals.
Mike, the small‑business owner, wanted a higher upside to fund a future hiring wave. He tried a Nasdaq‑100 option at 85 % participation, but the required premium jumped $40 a month—more than he could spare. He dialed back to a blended bond index at 60 % participation, and the cash value still met his $150 k reserve target, while keeping premiums stable.
Notice how a small change in index choice can reshape the whole picture? That’s the power of the indexed universal life calculator—it lets you experiment without risking real money.
Using an IUL for mortgage protection isn’t just theory—agents at Ogletree Financial show how a $250 k policy can both cover the loan and build a retirement bucket.
Don’t forget the hidden fees. Riders like over‑loan protection add a one‑time charge to the premium column. If you haven’t already, pop that line item into your spreadsheet; it often turns an “aggressive” scenario from attractive to too pricey.

Finally, schedule a 20‑minute call with a Life Care Benefit Services advisor. Bring your printed table, the decision matrix, and any questions about rider costs. A quick review will confirm whether the projected cash value truly covers your mortgage and retirement targets, or if a term policy plus a separate investment account would be smarter.
Bottom line: interpreting the results is about matching three numbers—cash value, death benefit, and premium—to three life goals—mortgage payoff, retirement income, and budget comfort. When they line up, you’ve got a plan that feels both realistic and rewarding.
FAQ
What exactly does an indexed universal life calculator do for me?
The calculator takes the three numbers you already have—your current death benefit, cash‑value balance, and premium amount—and runs them through the policy’s crediting rules. It then shows you projected cash value and death benefit at 5, 10, 15 and 20‑year marks. In plain language, you get a side‑by‑side view of how the policy could cover your mortgage, fund retirement, or act as a safety net without guessing.
How reliable are the projections from an indexed universal life calculator?
Projections are based on historical index performance, the participation rate you choose, and the policy’s cap and floor. They’re not guarantees, but they give a realistic range because the floor protects you from market loss and the cap limits upside. Think of it as a best‑case and worst‑case scenario that helps you see whether the policy meets your goals before you sign anything.
Can I use the calculator to compare an IUL with a term policy?
Absolutely. Run the indexed universal life calculator with your current numbers, then pull the same premium amount into a term‑only spreadsheet. Compare the death‑benefit cost versus the cash‑value growth you’d get with the IUL. If the term policy leaves you with a large cash‑gap for retirement or mortgage payoff, the IUL might be worth the extra premium.
Do I need to factor in rider costs when I run the calculator?
Yes, rider fees—like over‑loan protection or accelerated death‑benefit riders—add to the premium column. After you get the base projection, add any one‑time or recurring rider charges to see how they affect the cash‑value curve and the premium you’ll actually pay. This extra step often reveals whether an aggressive scenario stays affordable.
How often should I revisit the indexed universal life calculator?
Life changes fast, so we recommend running the calculator at least once a year or after any major event—like a new mortgage, a raise, or adding a child. Updating the death benefit, cash‑value balance, and premium ensures the projections stay aligned with your current financial picture and helps you catch any drift before it becomes a problem.
What’s the best way to interpret the cash‑value numbers for mortgage protection?
First, write down the exact balance you still owe on your mortgage. Then look at the projected cash value at the year you plan to retire or refinance. If the cash‑value plus any scheduled withdrawals meets or exceeds the mortgage balance, you’ve got a solid safety net. If there’s a shortfall, consider either boosting the premium or dialing back the participation rate to keep premiums manageable.
Conclusion and Next Steps
We’ve walked through gathering your numbers, picking an index, running a few scenarios, and translating those projections into real‑world goals. If the cash‑value curve lines up with your mortgage payoff or retirement supplement, you’ve got a solid safety net.
So, what’s the next move? Grab the snapshot you just created and set a 15‑minute call with a Life Care Benefit Services advisor. Bring your table, the index choices you tested, and any rider costs you’ve added. They’ll verify that the premium stays affordable and that the policy’s cost‑of‑insurance ladder won’t erode the growth you saw.
While you wait for the call, do a quick sanity check: does the projected cash value cover the goal you wrote down? Is the premium bump under 10 % of your take‑home pay? If either answer is “no,” flip back to the calculator, tweak the participation rate or cap, and run the model again. A couple of iterations usually reveal the sweet spot.
Finally, lock in a date to revisit the indexed universal life calculator at least once a year—or after any major life event like a new mortgage, a raise, or a growing family. Regular updates keep your plan aligned with reality.
Ready to turn those numbers into confidence? Schedule your free consultation today and let us help you keep the protection and growth on track.