

How to Use an Indexed Universal Life Retirement Income Calculator
Most free calculators hide a big cut. A 10% cap often ends up as a 4.2% credit. That can cut projected retirement income in half. If you rely on the raw number, you may be surprised later.
In this guide you’ll see how the indexed universal life retirement income calculator works, what data you need, how to enter it, and how to read the results. By the end you’ll be ready to run realistic scenarios and talk confidently with a Life Care Benefit Services advisor.
Step 1: Understand How Indexed Universal Life Generates Retirement Income
An indexed universal life (IUL) policy does two things. First, it gives a death benefit that goes to your beneficiaries. Second, it builds cash value that can grow tax‑free.
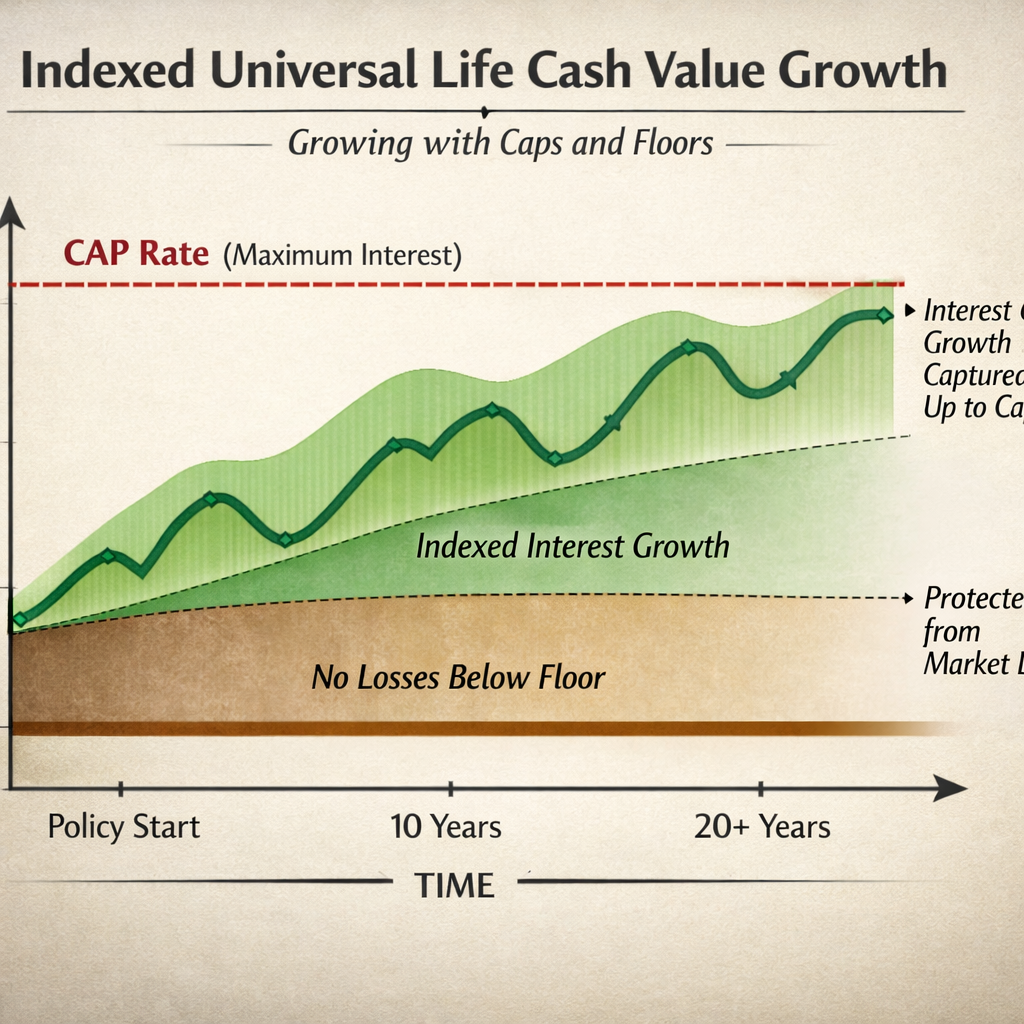
The cash value does not sit in the stock market. Instead the insurer looks at a market index , often the S&P 500 , and credits interest based on that performance. Most contracts use a cap (the highest rate you can earn) and a floor (the lowest rate, usually 0%). If the index climbs 12% and the cap is 10%, you get 10%. If the index drops 8%, the floor keeps you from losing cash value.
Credit can also be limited by a participation rate. A 70% participation rate means you only keep 70% of the index gain, after the cap.
While the cash value grows, the policy also charges a cost‑of‑insurance, administrative fees, and sometimes rider fees. Those costs eat into growth, especially early on.
When you reach retirement age, you can tap the cash value with policy loans. The loan is tax‑free as long as the policy stays in force. The loan balance and interest reduce the death benefit, but the remaining cash keeps growing.
Because the calculator can only use a single assumed growth rate, it often shows a ball‑park figure. Real illustrations use your exact age, health class, the carrier’s cap, participation rate, and fee schedule. That’s why you’ll see a gap between the calculator estimate and a licensed illustration.
For a clear definition of IUL and its mechanics you can check Wikipedia’s entry on indexed universal life insurance. It breaks down caps, floors, and crediting methods in plain language.
Bottom line:IUL gives you a death benefit and a cash‑value engine that can fund tax‑free retirement income, but the numbers depend on caps, participation, and policy costs.
Step 2: Gather the Financial Information You’ll Need
The calculator asks for personal and policy data. Getting that data together first saves you time and avoids guesswork.
Start with your age and gender. Most free tools assume a male non‑smoker with average health. If you are female or a non‑smoker, the cost of insurance will be lower and the cash‑value projection higher.
Next, write down the premium you plan to pay each month. The minimum is $353 on many calculators. Anything lower can push the policy into modified endowment contract (MEC) territory, which loses the tax‑free loan benefit.
Collect the policy’s cap rate and participation rate. Carriers often quote a 10% cap, but remember to apply a 30% haircut to be realistic , that brings the effective cap to about 7%.
Don’t forget the policy fees. Cost‑of‑insurance rises with age, so the fee schedule matters for long‑term projections.
Finally, decide on the retirement age you want to model. Most calculators lock you at 67. If you plan to retire earlier, note that the calculator won’t show that scenario.
Having all these numbers on hand lets you feed the calculator with real, not assumed, data.
Bottom line:Accurate inputs , age, gender, premium, cap, fees , are the foundation of a trustworthy retirement income projection.
Step 3: Input Your Data into the Calculator
Now that you have your numbers, it’s time to type them in.
Open the calculator on the insurer’s website or a trusted financial‑planning portal. The first fields will ask for your age and gender. Enter the exact numbers; the tool uses them to set the cost‑of‑insurance schedule.
Next, input the monthly premium you plan to pay. Remember the $353 floor , most calculators won’t let you go lower.
Enter the cap rate you expect. If the carrier’s illustration shows a 10% cap, type in 7% after the 30% haircut. Some calculators also let you set a participation rate , put the carrier’s number here.
Finally, add any rider costs you know about. If you have a chronic‑illness rider, add its annual charge.
When everything is filled, hit the calculate button. The tool will spit out projected cash value at retirement, the estimated loan amount you could take, and the likely death benefit.
Here’s a quick video that walks through the input steps on a typical IUL calculator:
The number looks neat, but remember it’s an assumption. Real policies may credit less after fees.
Bottom line:Feeding accurate, adjusted numbers into the calculator gives you a realistic snapshot of what your IUL could deliver at retirement.
Step 4: Analyze the Projected Retirement Income and Cash Value
When the calculator finishes, you’ll see a set of numbers and sometimes a chart. Treat them as a starting point, not a guarantee.
The cash‑value projection shows how much money could be in the policy at your retirement age. Compare that amount to the loan amount the calculator suggests you could withdraw tax‑free.
Look at the death‑benefit estimate. If you plan to take loans, the death benefit will shrink by the loan balance plus interest.
Check the assumed growth rate. If the tool used the default 5.91% and you know your carrier’s cap is lower, adjust your expectations.
Below is a simple comparison table you can use to line up three scenarios: low premium, medium premium, and high premium. Fill in your own numbers to see how each path changes cash value.
When you fill in the blanks, you’ll see a clear picture of how premium size drives cash value.
“The best time to start building cash value in an IUL was yesterday.”
For official guidance on how retirement income is taxed, the IRS provides a clear overview on taxation of retirement plan distributions. While the IUL loan is tax‑free, any excess withdrawal could be taxable.
After you’ve reviewed the numbers, ask yourself: does the projected loan meet the income you need? Do the fees look manageable? If the answer is yes, you’re ready to move forward.
Bottom line:Use the calculator’s output to compare cash value, loan potential, and death benefit, then match those to your retirement income goals.

Step 5: Compare Scenarios and Take the Next Step
Now that you have a few projections, it’s time to compare them side by side.
Start with a baseline scenario , the minimum premium you can afford. Note the cash value and loan amount.
Next, model a higher premium. See how the extra dollars boost cash value and loan power.
Finally, test an early‑retirement age if your calculator lets you adjust it. Even a few years earlier can change the loan timeline dramatically.
Write down the pros and cons of each case. A higher premium may give more income but costs more today. A lower premium keeps cash out of your budget but may not fund the lifestyle you want.
If you see a scenario that meets your target income, schedule a call with a Life Care Benefit Services advisor. They can take your calculator results and turn them into a carrier‑backed illustration that reflects your exact health class, cap, and fees.
For a broader view of retirement planning tools, the Social Security Administration’s retirement planner offers a solid benchmark for expected Social Security income on their official site. Compare the IUL loan amount to your expected Social Security benefits to see the total picture.
When you feel confident, move from the calculator to a formal illustration. That document will list the exact cost‑of‑insurance, rider charges, and loan interest rates. It’s the only way to lock in the numbers before you sign.
Bottom line:Compare multiple premium and timing scenarios, then work with a Life Care Benefit Services professional to lock in a real illustration.
Frequently Asked Questions
What is an indexed universal life retirement income calculator?
An indexed universal life retirement income calculator is a tool that estimates the cash value you could build in an IUL policy and the amount you could withdraw tax‑free as a loan when you retire. It uses your age, gender, premium, cap rate, and participation rate to give a rough picture. It’s a starting point, not a final guarantee.
Do I need to be a certain age to use the calculator?
The tool works for most adults between 30 and 55. It assumes you will retire at age 67 unless you change the projection. If you plan to retire earlier, tell the advisor so they can run a custom illustration that reflects the earlier payout.
Why does the calculator show a lower growth rate than the carrier’s cap?
Many calculators apply a built‑in haircut , about 30% , to the advertised cap. A 10% cap becomes roughly 7% after the haircut. This makes the projection more realistic because fees and policy charges often eat into the credited rate.
Can I model different premium amounts?
Yes. Most calculators let you type in any monthly premium above the $353 minimum. Changing the premium lets you see how cash value and loan potential rise or fall. Try a low, medium, and high premium to find the sweet spot for your budget.
What happens to the death benefit if I take a loan?
The loan balance and accrued interest are subtracted from the death benefit. If you borrow $100,000 and owe $10,000 in interest, the death benefit will be lower by $110,000. The policy stays alive as long as the cash value can cover the cost‑of‑insurance.
Is the income from an IUL loan really tax‑free?
Yes, as long as the policy stays in force and the loan does not exceed the cash value. If the policy lapses, the loan could be treated as a distribution and become taxable.
How does an IUL compare to a 401(k) for retirement income?
An IUL adds a death benefit and offers tax‑free loans, while a 401(k) provides tax‑deferred growth but withdrawals are taxed. IUL growth is capped, which can protect you from market drops, whereas a 401(k) can rise higher but also fall.
What should I do after I get the calculator results?
Take the numbers to a licensed advisor at Life Care Benefit Services. They will request a formal illustration from the carrier, adjust the cap and participation rates to realistic levels, and show you the exact loan interest and fee schedule.
Conclusion
Using an indexed universal life retirement income calculator helps you see a rough picture of how much tax‑free income you could pull from a policy. The key is to feed it accurate personal data, apply a realistic cap‑rate haircut, and understand how fees and loans affect the death benefit.
Once you have a few scenarios, bring them to a Life Care Benefit Services specialist. They can turn the calculator’s estimate into a carrier‑backed illustration that respects your health class, premium level, and retirement age.
Ready to move from numbers on a screen to a concrete plan? Schedule a free consultation with Life Care Benefit Services today and get a personalized IUL illustration that matches your retirement goals.