

Indexed Universal Life Cash Value Growth Calculator Guide
Getting the numbers right can feel like cracking a safe. An indexed universal life cash value growth calculator gives you a clear picture of how your policy could grow over decades. In this guide you’ll see how to collect the right data, feed it into the tool, and turn the output into a solid retirement plan.
Step 1: Gather Your IUL Policy Details
First things first , pull your most recent policy statement. Look for the death benefit amount, the current cash value, any riders you’ve added, and the premium you’re paying each month. If you’re still shopping, use the quote you received from the carrier. Having these numbers on hand makes the calculator work with real data instead of guesswork.
Next, note your age, gender, and health classification. Insurers use this info to set the cost‑of‑insurance (COI) charge, which eats into cash value each year. A younger, healthier applicant typically sees lower COI, so the cash value climbs faster.
Don’t forget the policy’s cap rate, participation rate, and floor. These three knobs decide how much of the index’s gain actually gets credited. If your policy caps at 10% and the S&P 500 climbs 12%, you’ll only see 10% added to cash value. The floor (often 0%) protects you when the market drops.
Gathering all these pieces takes a few minutes, but it saves you hours later when you’re tweaking scenarios. Imagine you’re a teacher with a mortgage; you’ll want to see how extra premium payments could speed up cash‑value build‑up and help pay off the loan early.
“A solid IUL illustration starts with accurate policy inputs; without them, the calculator is just a guessing game.”
For a plain‑language definition of indexed universal life insurance, see Wikipedia’s IUL page. It breaks down the death‑benefit and cash‑value mechanics in easy terms.
When you have everything written down, you’re ready to move to the next step: feeding historic index data into the calculator.
Step 2: Input Historical Index Data
The calculator needs to know how the market has moved in the past so it can project forward. Most tools let you pick a benchmark , the S&P 500 is the most common choice. You’ll see a drop‑down menu where you select the index and the time frame (one‑year, three‑year, ten‑year). The tool then pulls the historical returns from its database.
If you want to see how a more conservative index would behave, look for options like a “balanced” index or a volatility‑controlled version. Some calculators even let you load multiple indexes and split your cash value between them.
Remember that past performance isn’t a guarantee, but it does give you a realistic range. For example, over the last 20 years the S&P 500’s average annual return was about 9%. A capped strategy at 10% would have captured most of that upside, while a 0% floor kept the cash value safe during downturns.
When you enter the data, the calculator will usually ask for the participation rate you expect , often 80% to 100% , and the cap you’ve been quoted. If your policy doesn’t state a cap, you can use the carrier’s typical range (8%‑12%).
Once the index numbers are set, you’ll see a projected cash‑value curve that reflects the chosen cap and participation. This curve is the baseline you’ll tweak later with different premium scenarios.
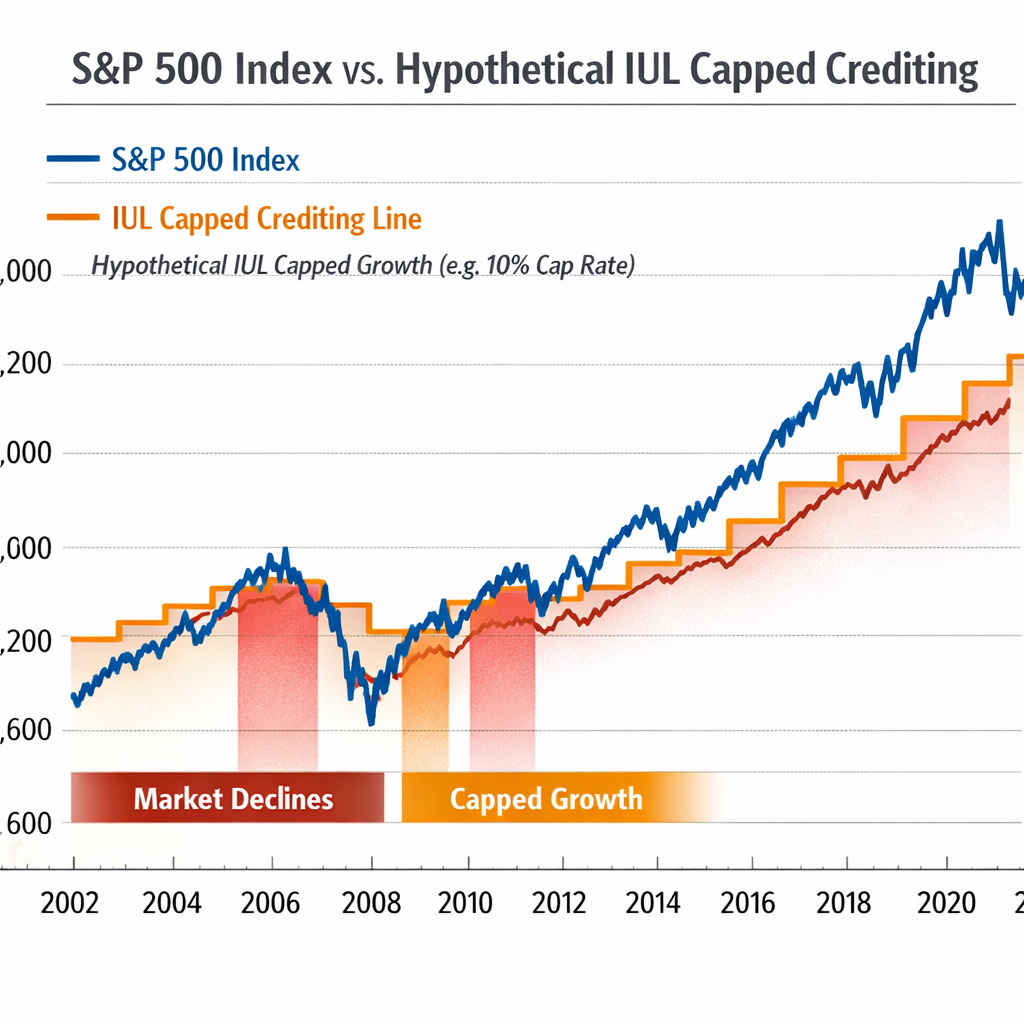
For official information about how index crediting works, the National Life Group explains the floor, cap, and participation mechanics in its policy documents.
With the index data in place, you can start adjusting premium amounts and see how the cash value reacts.
Step 3: Choose Crediting Method & Set Parameters
Indexed universal life policies offer several crediting methods. The most common are annual point‑to‑point, monthly point‑to‑point, and a fixed‑interest option. Each method measures the index’s gain over a different period, which changes the credited amount.
Annual point‑to‑point looks at the index value on the policy anniversary date and compares it to the value one year earlier. Monthly point‑to‑point does the same each month, which can smooth out big swings but also adds more caps.
When you pick a method, you also set the participation rate and cap. A higher participation rate (e.g., 100%) means you capture more of the index’s gain, but the insurer may pair that with a lower cap to limit risk. Conversely, a lower participation (80%) often comes with a higher cap (12%).
Here’s a quick math check: suppose the index gains 7% in a year, your participation is 90%, and your cap is 10%. The credited rate is the lesser of (7% × 90% = 6.3%) and the cap (10%). So you’d get 6.3% added to cash value.
Don’t forget the floor , most IULs guarantee a 0% floor, meaning you never lose cash value due to a negative index year. Some carriers offer a 1% floor, which adds a tiny upside even when markets slide.
For a deeper dive on cap rates, see The Policy Shop’s explanation of cap rates. It walks through why insurers set caps and how they protect both sides.
Now that you’ve set the crediting knobs, you can move on to analyzing the cash‑value projections.
Step 4: Analyze Projected Cash Value Scenarios
With the index and crediting parameters entered, the calculator will spit out a cash‑value timeline. This timeline usually shows the projected balance at each policy year, the amount of premium paid, and the estimated cost‑of‑insurance charge.
Look at the early years first. Because COI and fees are higher when the cash value is small, you may see slower growth or even a dip if you under‑fund the policy. That’s why many advisors recommend a front‑load strategy: pay a little extra for the first three to five years to build a cushion.
Next, examine the middle years (age 40‑55). Here the cash value should start to outpace COI, and the compounding effect kicks in. If the projected cash value stays above the COI line, the policy is on track to stay in force without extra premiums.
Finally, look at the retirement horizon (age 65‑70). The calculator will often show a projected tax‑free income amount based on a policy loan against the cash value. Compare that number to your retirement budget to see if the IUL fills the gap.
To make sense of the numbers, create a simple comparison table. List three scenarios: a low‑premium baseline, a front‑load boost, and a high‑participation‑high‑cap combo. Then compare cash value, projected loan income, and total premiums paid.
Notice how the front‑load scenario builds a larger cushion early, while the high‑participation plan delivers the biggest balance at retirement despite a modest premium.
When you spot a scenario where the cash value dips below the COI line, that’s a red flag. You’ll need to either increase premium or choose a higher participation rate.
For a solid definition of cash value and how insurers illustrate it, see Ethos’s cash‑value chart overview. It explains guaranteed versus projected growth in plain language.
Step 5: Interpret Results & Plan for Retirement
Now that you have the projection tables, it’s time to turn numbers into action. Start by matching the projected tax‑free loan income to your retirement cash‑flow gap. If you need $40,000 a year after age 65, look for a scenario that shows at least that amount in loan income.
Next, check the policy’s surrender period and any rider charges. Some living‑benefit riders add a cost that can shave off cash value in later years. Weigh the extra protection (e.g., chronic‑illness rider) against the reduced loan income.
Think about how you’ll fund the policy in retirement. If the cash value is high enough, you can let it cover the COI, turning the policy into a “zero‑cost” vehicle. That means you stop making premium payments, and the policy lives off the cash value while still providing a death benefit.
Don’t forget tax considerations. The IRS treats policy loans as non‑taxable as long as the policy stays in force ( IRS guidance on policy loans). However, if the loan exceeds the cash value, the excess may be considered a distribution and could be taxable.
Finally, set a review schedule. Check the illustration every year, compare actual index performance to the assumptions, and adjust premiums if cash value is lagging. A simple spreadsheet that tracks premium paid, COI charged, and cash value each year helps you stay on top of the policy’s health.

For official retirement age information, see the Social Security Administration’s page on full retirement age ( SSA full retirement age).
FAQ
What information do I need to feed into an indexed universal life cash value growth calculator?
You’ll need your age, gender, health class, current death benefit, cash value, premium amount, policy’s cap rate, participation rate, floor, and the crediting method (annual or monthly). Having these details lets the calculator produce realistic projections rather than generic estimates.
How accurate are the projections from an indexed universal life cash value growth calculator?
The calculator uses historic index returns and your policy’s parameters, so the numbers are as accurate as the inputs. They give a solid ballpark, but real‑world results can vary due to actual index performance, changes in COI, and any rider adjustments you make over time.
Can I change the index or crediting method after I’ve started the policy?
Yes. Most carriers let you switch index strategies or move between annual and monthly point‑to‑point at the start of a new crediting period. Changing the method will alter future cash‑value growth, so run a new scenario in the calculator before you submit the change.
What’s the difference between a capped and an uncapped IUL strategy?
A capped strategy limits the maximum credit you can earn each period (e.g., 10%). An uncapped strategy removes that ceiling but may use a lower participation rate or higher fees. Capped plans protect against extreme market spikes, while uncapped plans can capture more upside in strong markets.
How do policy loans affect my cash value and death benefit?
When you take a loan, the amount is deducted from the cash value, and interest accrues on the loan balance. The death benefit is reduced by the outstanding loan amount. However, the loan proceeds are generally tax‑free as long as the policy stays in force.
Should I use the calculator to compare different carriers?
Absolutely. Input each carrier’s specific cap, participation, and fee structure into the calculator. Comparing the projected cash values and loan income side‑by‑side helps you spot which carrier offers the best net growth for your budget.
How often should I revisit my IUL projections?
Review at least once a year, or after any major life event (new job, change in health, or market volatility). Updating the illustration ensures your premium level still covers COI and that your retirement income goal remains on track.
Can I rely on the calculator instead of meeting with an agent?
The calculator is a powerful planning tool, but it doesn’t replace a professional illustration. An agent can incorporate carrier‑specific fees, rider options, and tax considerations that the generic calculator may miss.
Conclusion
Using an indexed universal life cash value growth calculator turns abstract policy language into specific numbers you can act on. By gathering accurate policy details, feeding historic index data, and testing different crediting methods, you build a realistic view of how the cash value will grow. Analyzing multiple scenarios helps you pick the premium level and participation rate that meet your retirement income goal while keeping the policy affordable.
Remember to watch the floor, cap, and rider costs, and schedule regular reviews so the policy stays on track. When you combine the calculator’s output with a professional illustration, you get a retirement plan that offers both a death benefit for your loved ones and a tax‑free source of income for yourself.
If you’re ready to see a personalized projection, try the Life Care Benefit Services indexed universal life calculator. It lets you tweak caps, participation rates, and living‑benefit options to design a plan that fits your family’s future.