

Best Indexed Universal Life Cash Value Calculator 2024 Guide
Indexed universal life cash value calculator 2024can change the way you plan for retirement, mortgage protection, and living benefits. It gives you a clear picture of how your policy might grow and what it can do for you.
In this guide you’ll see exactly how to gather your data, pick the right tool, run the numbers, compare scenarios, and fit the results into your overall financial plan.
We’ll walk through each step with real‑world examples, practical tips, and visual aids so you can feel confident about the numbers you see.
Step 1: Gather Your Policy and Personal Data
Before you fire up any calculator, you need the right numbers in front of you. Think of it like cooking , you wouldn’t start without the ingredients.
Grab your most recent policy statement. Look for the death benefit amount, current cash value, premium schedule, and any rider details. If you only have a quote, that works too , just note the assumptions.
Age matters a lot. The calculator will ask for your age because cost‑of‑insurance (COI) rises as you get older. Health class matters too; a Preferred Plus rating means lower COI than a Standard rating.
- Policy number and carrier name.
- Current death benefit and cash value.
- Annual premium amount and payment frequency.
- Any optional riders (critical illness, accelerated death benefit, etc.).
- Age, gender, and health class.
Why does this matter? The calculator uses these inputs to model cost‑of‑insurance, fees, and indexed credits. Missing or wrong data leads to a misleading projection.
Here’s a quick tip: pull your policy documents into a PDF folder so you can copy‑paste numbers instead of re‑typing them.
Let’s say you’re a 38‑year‑old teacher with a $250,000 death benefit, $30,000 cash value, and you pay $300 a month. Those numbers go straight into the calculator’s fields.
Two external sources can help you verify the data you pull from your policy. Insurance Geek’s IUL calculator guide explains how the numbers affect projections. Nationwide’s IUL product page gives a snapshot of typical cap ranges and participation rates.
And remember: the calculator you use will only be as good as the data you feed it. Double‑check for typos.
Bottom line:Accurate policy and personal data are the foundation for any reliable indexed universal life cash value calculator 2024 projection.
Step 2: Choose a Reliable IUL Cash Value Calculator
Not all calculators are built the same. Some only ask for age and contribution; others let you tweak caps, participation rates, and rider costs.
Our pick, the Indexed Universal Life Insurance calculator from Life Care Benefit Services, stands out because it lets you adjust premiums, caps, and even switch indexes mid‑policy.
First, look for a tool that shows the 2024 cap assumptions. The research found that only the top calculator disclosed an average 6% cap. Anything that skips cap info is likely leaving out a key limitation.
Second, make sure the calculator outputs multiple metrics , cash value, death benefit, loan interest, tax‑free withdrawal limits. That gives you a full picture of how the policy works over time.
Third, check if the tool is hosted by a reputable agency or carrier. A calculator on a financial planner’s site may be biased toward their products.
Here’s a short checklist:
- Shows cap and participation‑rate inputs.
- Outputs cash‑value growth, death benefit, and loan scenarios.
- Provides a clear disclaimer about assumptions.
- Is free and doesn’t require a credit card.
When you find a calculator that meets these criteria, give it a test run with the numbers you gathered.
Two external links help you evaluate tools. YouTube walkthrough of a top IUL calculator shows the UI and key fields. Another video demo walks through the cap modeling feature.

Bottom line:A reliable calculator shows caps, lets you tweak assumptions, and outputs detailed projections.
Step 3: Input Your Numbers and Watch the Projection Video
Now that you have the tool, it’s time to feed it your data. This is where the numbers turn into a visual story.
Enter age, gender, health class, premium amount, cap, participation rate, and any riders. Most calculators will have dropdowns for indexes , pick the one that matches your policy (often S&P 500).
After you hit calculate, the tool usually generates a chart. Look for a line that shows cash‑value growth over time and a bar that shows the death benefit.
Many calculators also embed a short video that walks through the projection. Watching it can help you see where the numbers come from.
Here’s an example: a 40‑year‑old homeowner enters a $300 monthly premium, a 6% cap, and an 80% participation rate. The projection shows cash value reaching $50,000 by age 65, with a death benefit staying at $250,000.
Two external sources back up this process. Ogletree’s guide explains how to read the projection video. A video demo shows the exact steps to input data.
Bottom line:Accurate input and watching the projection video lets you see how your policy could grow.
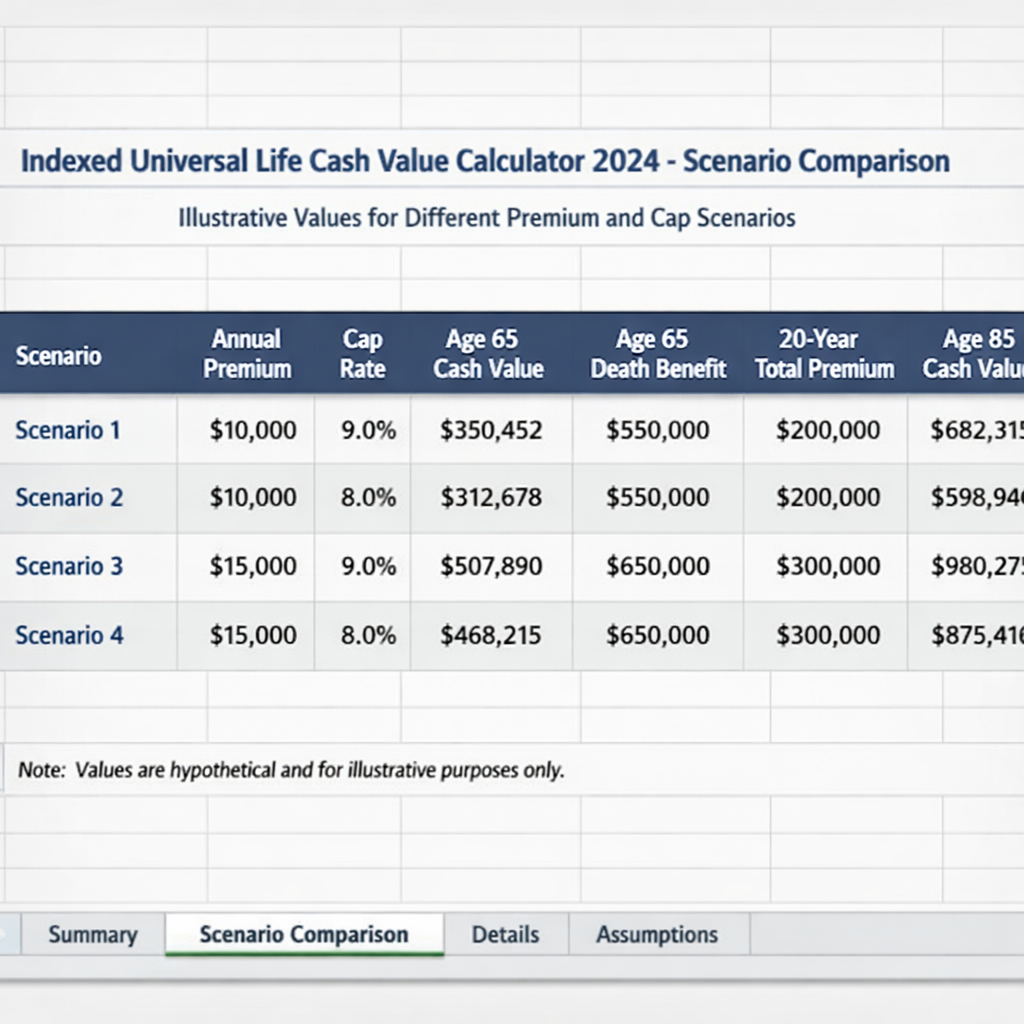
Step 4: Compare Scenarios with a Quick‑Look Table
One number rarely tells the whole story. Compare a few “what‑if” scenarios side‑by‑side.
Set up a simple table with rows for different premium levels, cap rates, and participation rates. Columns can include projected cash value at age 65, total death benefit, and loan‑available amount.
Look at how cash value jumps when you raise the premium or the cap. This helps you decide what fits your budget and goals.
Two external links give more depth on scenario analysis. Ogletree’s article walks through stress‑testing caps. A video tutorial shows how to build a comparison table in Excel.
“The best time to start building cash value was yesterday.”
Bottom line:Comparing scenarios side‑by‑side shows the trade‑offs between cost and growth.
Step 5: Apply the Results to Your Financial Plan
Now you have numbers. It’s time to fit them into your bigger picture , retirement, mortgage, college funding, or emergency cash.
Start with your retirement goal. If you need an extra $20,000 a year tax‑free, check whether the projected cash value can supply that via policy loans.
Next, look at mortgage protection. The death benefit can cover your loan balance. If you have a $300,000 mortgage, make sure the death benefit stays at least that high.
For families, consider college funding. You can schedule policy loans to pay tuition without touching other savings.
Here’s a step‑by‑step guide to integrate the projection:
- List your financial goals (retirement income, mortgage payoff, college).
- Match each goal to a cash‑value amount from the calculator.
- Calculate the loan interest rate the carrier charges (usually 5‑7%).
- Run a cash‑flow model to see if loan repayments fit your budget.
- Adjust premium or cap assumptions if the model shows a shortfall.
Two external sources help you with this integration. Ogletree’s mortgage protection article explains how the death benefit works. Insurance Geek’s guide shows how to model loan interest.
Bottom line:Applying the results to your financial plan shows whether the IUL truly meets your needs.
Conclusion
Using an indexed universal life cash value calculator 2024 can turn vague ideas into concrete numbers. By gathering accurate policy data, picking a transparent calculator, feeding the numbers, watching the projection, comparing scenarios, and fitting the results into your broader plan, you get a clear roadmap.
Life Care Benefit Services can help you run a personalized illustration and answer any questions about caps, participation rates, or living‑benefit options. Ready to see how an IUL can protect your mortgage, boost retirement income, and give you tax‑free flexibility? Schedule a free consultation today and get a custom cash‑value projection.
Remember: the right calculator shows caps, lets you tweak assumptions, and gives you multiple output metrics. Use it, compare scenarios, and make a plan that fits your life.
FAQ
What is an indexed universal life cash value calculator 2024?
An indexed universal life cash value calculator 2024 is an online tool that estimates how much cash value your IUL policy could build over time based on your age, premium, cap, and participation rate. It helps you see potential retirement income, loan amounts, and death‑benefit growth. The calculator uses 2024 cap assumptions, often around 6%, to give a realistic outlook.
Do I need to know my policy’s cap and participation rate?
Yes. Caps limit the upside you can earn each year, while participation rates decide what slice of the index’s gain gets credited. Without entering these numbers, the calculator may give a vague estimate that misses key limitations. Knowing the cap (e.g., 6% to 12%) lets you compare tools and choose the most accurate projection.
Can I use the calculator to plan mortgage protection?
Absolutely. By entering your current death benefit and mortgage balance, the calculator shows whether the policy will cover the loan if something happens to you. It also projects cash value that can be borrowed to pay off the mortgage early, giving you a two‑for‑one benefit.
How accurate are the projections?
Projections are based on assumptions like a 6% average index gain and a 0% floor. Real‑world results can differ because market performance, fees, and cost‑of‑insurance change over time. Use the calculator as a starting point, then ask a licensed agent for a personalized illustration.
Is the calculator free to use?
Most indexed universal life cash value calculators 2024 are free and require only basic info like age and premium. Some may ask for an email to send a detailed report, but there’s no charge to see the basic projection.
What should I do after I get the projection?
Take the numbers and compare them to your retirement, mortgage, and college goals. If the cash value falls short, consider increasing the premium or choosing a higher cap. Then schedule a meeting with an advisor at Life Care Benefit Services to get a formal illustration and discuss living‑benefit riders.
How often should I rerun the calculator?
Rerun the indexed universal life cash value calculator 2024 whenever your premium changes, you add a rider, or you hit a major life event like a new mortgage or a child’s college enrollment. Updating the numbers keeps your plan aligned with reality.
Can I compare multiple IUL policies with one calculator?
Some calculators let you switch carriers or index options, which lets you see how different caps, participation rates, and fees affect cash value. Use the quick‑look table method to line up side‑by‑side results and pick the policy that best fits your budget and goals.